- Introduction
Two characteristics the construction industry is known for are its fragmented data, which comes from a range of sources, and the difficulty in making accurate and timely forecasts of approvals and activity levels. Until recently, construction measurement and forecasting have primarily used traditional data sources, such as the industry and national statistics produced by public agencies and private sector organisations (Best and Meikle, 2015). Now, however, new data sources and new data analytic tools are available, and these allow incorporation of ‘big data’ into construction analysis and forecasting.
Big data is name given to the large data sets collected from users through platforms like Google and Facebook. These can be analysed to reveal patterns, trends, and associations, and then used for analytical and predictive purposes. Initial applications of artificial intelligence and big data analytics were in finance, marketing and for political predictions[1]. It is argued here that with the amount of information generated every day and innovative methods to analyse it, artificial-intelligence-based big data analytics can shed some light on better construction and forecasting.
This study focuses on analysing and forecasting output of the British housing market, the most homogenous market in the British construction industry, and explores the possibility of improving housing output forecasting models using big data resources and artificial intelligence tools. After a review of related econometric and natural language processing studies, a new analytical and predictive framework is introduced. This is followed by a detailed forecasting section that adds big data topics to economic and market statistics in a regression-based forecasting model. The paper concludes with proposals for further research.
- Literature Review
This section is presented in two parts. The first part documents mainstream macroeconomic forecasting using various econometric models applied to construction output.. The second part presents recent developments in artificial intelligence and big data analytics relevant to the construction industry, and discusses potential applications from the Google Trends big data set.
- Econometric Methods for Predicting Construction Output
Both industry providers of construction forecasts[2] and academic researchers have applied econometric methods in predicting housing output. This section reviews the univariate and multivariate time series econometric techniques adopted by construction economists.
- Univariate Time Series Models
One of the first econometric methods adopted by forecasters, univariate time series models base forecasts of construction output on past values. They have been widely used, and are popular largely because they are technically simple and require less costly data collection.
The univariate modelling techniques include auto-regressive integrated moving average (ARIMA) models, regime switching models and state space models.
A univariate approach like ARIMA adopts the Box-Jenkins technique to forecast construction demand, price and productivity: examples are Fan et al. (2010), Hua and Pin (2000), and Miles (2008). Although ARIMA models fit in-sample data well, they do not provide solid predictions when there are structural breaks such as construction downturns and economic recessions (Larson, 2011). Research by Zietz and Traian (2014) found that state space models proposed by Hyndman et al. (2002) and by De Livera et al. (2011) performed much better in out-of-sample forecasts than both ARIMA models and traditional regime switching models. Their state space models are very sensitive to find the shocks to the slope or drift of the trend and predict changes in the US housing market.
- Multivariate Time Series Models
Researchers have also used multivariate models to identify the key economic variables and their influence on construction output and price (Fan et al. 2010). There are three groups of multivariate modelling methods: multi-regression, vector autoregressive (VAR) and vector error correction (VEC) models.
McCaffer et al. (1983) forecast the construction price with a multivariate regression incorporating a tender price index, building cost index and output index of construction work. Since then multivariate regression techniques have been used by other researchers to predict construction output and prices. Using a linear multiple regression model, Akintoye and Skitmore (1993) predicted construction price, demand and supply with economic indicators. Akintoye and Skitmore (1994) then used similar techniques to model and forecast quarterly demand for output of residential, commercial and industrial construction using data on gross national product, price level, real interest rate, unemployment and manufacturing profitability.
With advances in multivariate modelling techniques, many studies (Dorward et al., 1998; Fan et al., 2010; Wong and Ng, 2010) adopted VAR and VEC models for predicting construction output and price. Based on a framework from Haynes and Stone (1985), Yu’s (2015) VAR model estimated demand and supply of new building work. Based on a stock-flow relationship of housing starts, completions and units under construction between 1981 and 2013, Lunsford (2015) forecast residential investment using various standard univariate and multivariate models. After comparing the forecast errors of the models, he proposed adopting a VEC model, which improved current quarter forecasts from the univariate models and multi-step forecasts of other multivariate models. What is more, the forecasts from the VEC were quite robust and precise during the global economic crisis when economic conditions were most volatile.
- Application of Big Data Analytics to Construction Markets
Following Laney (2001), big data is defined by its huge amount (volume), vast number of types (variety), and fast speed of processing (velocity). Throughout the life cycle of building projects, big data is generated within the construction industry, and with advances in technology for storing, computing, processing, analysing, and visualising data, big data analytics has recently been applied to analysing construction markets (Bilal et al., 2016).
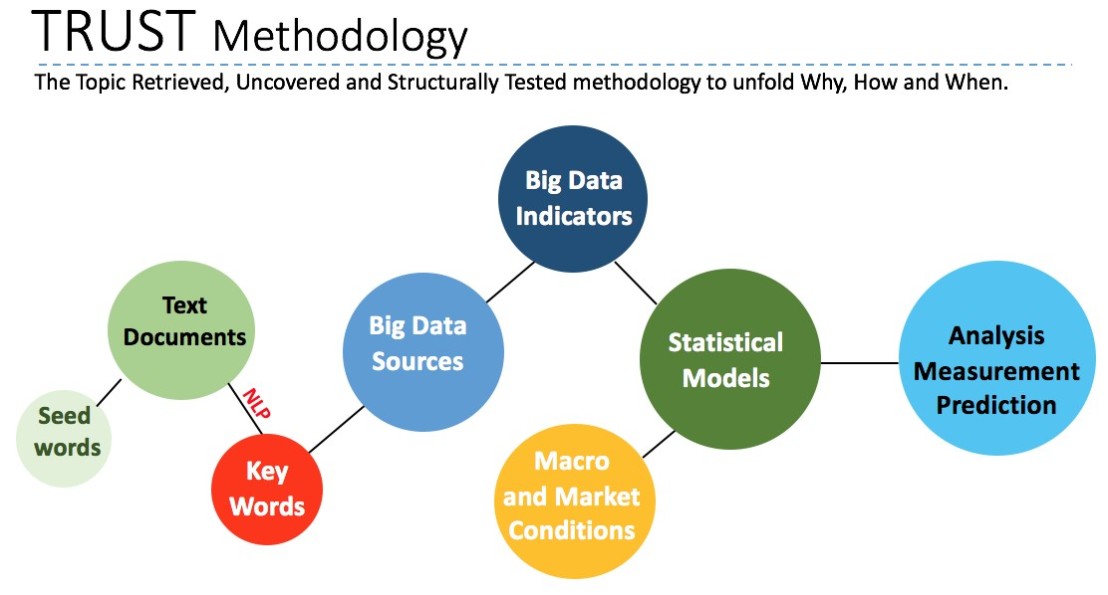
According to Dean (2014), big data analytics focuses on finding useful patterns in big data with methods from different academic fields including business analytics, data mining, knowledge discovery, predictive analytics and statistical modelling. Shown in Figure 1, big data analytics has broadened the field of data analytics and incorporated many of the techniques that have already been performed to process large amounts of diverse data on a large scale.
Besides statistical modelling and data mining, machine learning (ML), a sub-field of Artificial Intelligence (AI), plays an important role in big data analytics. Machine learning enables automatic computational learning from data about specific classification, clustering, association or prediction tasks (Witten and Frank, 2005). Bilal et al. (2016) documented five main machine learning techniques, i.e., regression, classification, clustering, natural language processing, and information retrieval.
Regression and classification techniques are supervised machine learning techniques including logistic regression, naive Bayes, decision trees, support vector machine (SVM), artificial neural networks (ANN) and genetic algorithms (GA). Since Li (1995) and Williams (1994) adopted ANN for predicting construction cost, ANN has been used for construction economic research (Goh, 2008). Wilmot and Mei (2005) apply ANN for analysing a construction index and conclude that the results are better than the results produced by regression analysis. While ANN is able to cope with complex relations, it requires massive amount of data and is not good at explaining results in the absence of theories. Meanwhile, more out-of-sample predictions are needed to validate the robustness of ANN-based predictions.
With the development of machine learning techniques, unsupervised machine learning methods including clustering, natural language processing, and information retrieval are being applied for construction analyses. As one advanced machine leaning technique, natural language processing provides basic concepts and methods for text processing and analysis by using computational models that resemble linguistic abilities of human beings. Al-Qady et al. (2009) and Zhang and El-Gohary (2012, 2016) use NLP to automatically extract concept relationships from construction contractual and regulatory documents. While NLP can improve knowledge acquisition and retrieval through tagging, separating, and sequencing to generate high quality ontology, it has not previously been adopted for improving construction statistics measurement and prediction.
Figure 1: Multidisciplinary Nature of Artificial Intelligence and Big Data Analytics

Source: Dean (2014) and Bilal et al. (2016)
- Predictions with Google Search Indices
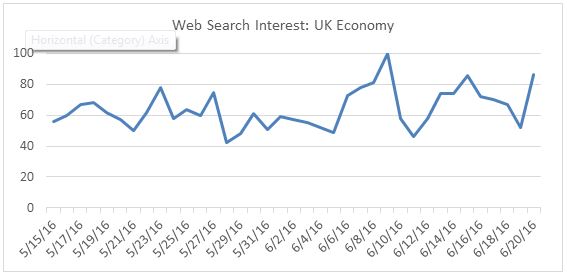
With the dramatic development of Internet information and big-data technology, there is now growing evidence that Internet online search indexes can be used for prediction purposes (Choi and Varian, 2012). Google Trends is a service, provided by Google, to allow researchers access to the real-time relative online search volume for any keyword within any region of the world. The Google Trends data are presented in a [0, 100] interval. The index of a particular term presents the percentage of search volume relative to the total search volume over time. The larger the index is, the higher the information demanded and searches are for this term. As of October 2017, Google enjoyed an 87% share of web search volume worldwide (Statista Inc., December 7, 2017). Given its dominance in the web search market, researchers in various fields have started to analyse information demand with the Google Trends data.
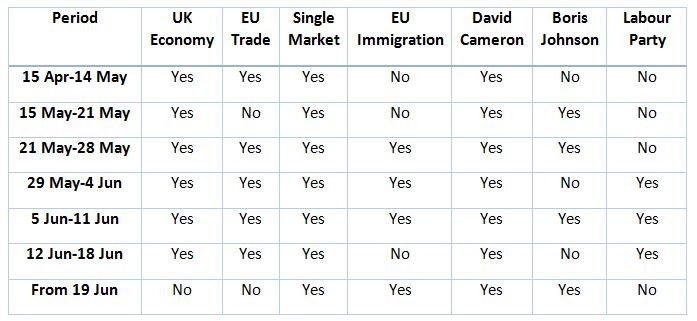
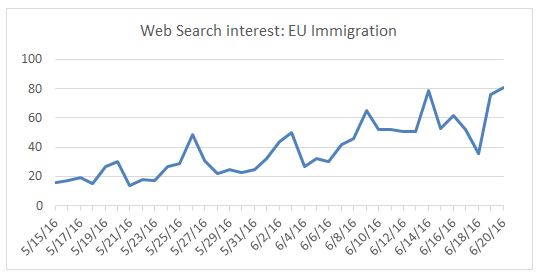
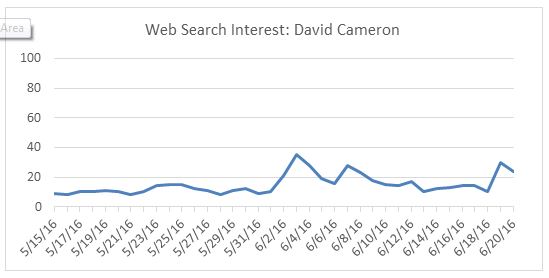
There is growing evidence that Google Trends indexes are useful in forecasting trends in stock prices (Da, et al., 2011), stock price volatility and trading volume (Aouadi et al., 2013; Takeda and Wakao, 2014; Vlastakis and Markellos, 2012), exchange rate volatility (Goddard et al., 2015) and financial index returns (Vozlyublennaia, 2014). Besides predictions in the financial markets, Fondeur and Karamé (2013) indicated that the model with Google search volume data predicted unemployment much better than the one without. MacDonald and Mao (2015, 2016) used the Google Trends data to predict the 2014 Scottish referendum and 2015 UK general election results, and demonstrated that Google Trends data can work as a good election predictor if the search terms are chosen by rigid text mining methods and only the most relevant and significant themes are selected through statistical tests.
Recently, internet search indexes data has been used to examine and predict changes in house prices. Where Das et al. (2015) and Wu and Brynjolfsson (2015) found that Google search frequencies are correlated with US house price, Wei and Cao (2017) showed that Google search volume could be a good predictor for house prices in China. However, no research has been conducted for predicting housing output.
For decades, academic researchers have used various econometric techniques, including univariate and multivariate models, to predict construction output. Although recent developments in univariate time series modelling techniques may increase the prediction robustness amidst potential big event risk, they are not able to capture effects of key factors based on construction economic theories (Fan et al., 2010) and hence cannot explain why huge fluctuations happened. The multivariate models provide a coherent framework to predict a relationship between dependent and independent variables and examine their short-term dynamic behaviour. Meanwhile the theory-driven multivariate models can provide more robust predictions of construction output and price (Zietz and Traian, 2014).
While big data is gradually emerging in the construction industry, with trends such as Building Information Modelling, smart buildings, and augmented reality, it has not been widely used for construction predictions. Although economists have started to use Google search data to predict house prices, they have not adopted advanced machine learning techniques such as natural language processing for predicting construction output.
In summary, although artificial intelligence and big data analytics has got the attention of researchers in the construction industry, there are research gaps: Firstly, there is no study on using natural language processing to select key phases for constructing big data indices. Secondly, there is no research using big data such as Google search data for predicting construction output in the housing market. In the following sections, we aim to fill these research gaps by using natural language processing to select key Google search phases, and predict housing output with Google Trends, macroeconomic and market conditions data within a multivariate time series model.
- An Analytical Framework
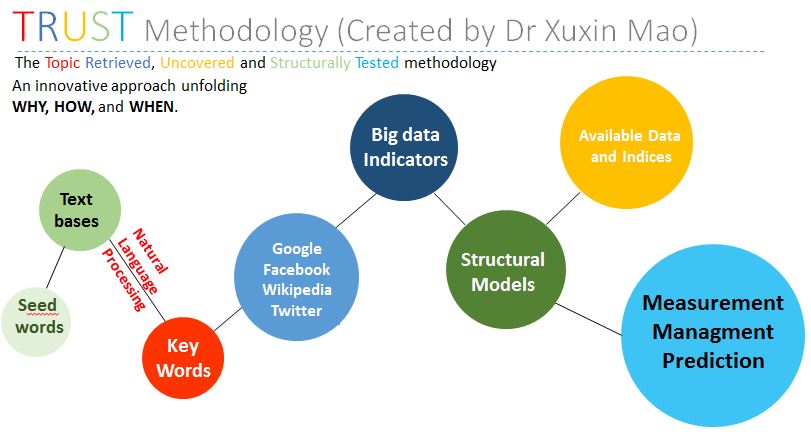
Before we conduct our analysis and prediction, we present in this section an analytical framework, a topic retrieved, uncovered and structurally tested (TRUST) methodology, to incorporate the developments in natural language processing, big data, and multivariate time series modelling (Figure 2).
Defined as the net amount charged by construction companies to customers for the value of housing work, housing output is an important short-term indicator of construction output. It is dependent not only on macroeconomic and market conditions, but also the changing demand from potential house buyers. With house-related topics from print and online contents of newspapers and related documents, potential house buyers are searching the Internet for information regarding their decisions. By constructing related internet text search data sets, we can measure housing demand and housing market sentiment more closely, and hence introduce new information for predicting housing output from the demand side.
Figure 2: The TRUST Framework
The objects of our text mining are text files of all related reports on the housing market from all national newspapers in the UK. We use these newspapers because the readership of newspapers is rising across different age groups, with the readers of their online contents[3] at a similar amount as social media users in Britain (ONS, 2017). Meanwhile, national newspapers still play the ‘newspaper of record’ role and are the main content creators and dominate the conversation agenda of social media. Newspaper reports also follow rigid language routines and are suitable for natural language processing.
Our empirical analysis starts with ‘seed words’ for the British housing market – specifically, “Britain”, “House”, “Real Estate” and “Property”. We used Lexis Nexis searches applied to all UK national newspapers and related documents, and generate a text file containing thousands of related reports with major mentions of the GB housing market. We then adopt a standard natural language processing tool – the Latent Dirichlet Allocation (LDA) method (Blei et al., 2003) to retrieve up to 30 key words.
The key words can be classified into two groups. The first group is about general but not economically related information of the British housing market, e.g., names, and some places like London, England, etc. The second group is more closely related to the British house output, which includes several related themes on macroeconomic factors and market conditions. We only adopt key words from the second group based on the consideration of economic factors and related theories.
We then construct our big data indicators based on the volume of Google searches. With the key topics explored in the reports’ text, we find key words used for Google searches based on the following criteria. Firstly, they must have the same meaning as the key topics in the news. Secondly, they are the searches with the largest volume, which means that they interest potential house market participants the most.
In line with the mainstream econometric research, we adopt a popular multivariate time series VAR methodology, which permits the structural testing of the significance of effects of big data indicators, macroeconomic factors and market conditions. Our framework seeks to improve modelling and forecasting practices by expanding the range of key factors, and identifying the key relationships.
- Data Description
In this section, we present our data used for later analysis and prediction of GB housing output. Therefore, we first find data reflecting big data, macroeconomic and market conditions to analyse and forecast monthly growth rates of housing output in Great Britain. In Table 1 we report the text-mined topics for the GB housing market between January 2004 and November 2017. To test the robustness of the algorithm, we mine topics across different periods with different economic and political situations. The four periods are the Pre-Great-Recession period[4] between January 2004 and March 2008, the Great Recession period between April 2008 and September 2009, the following economic recovery period from October 2009 to June 2016 when UK voted to leave European Union, and the most recent period after the referendum from July 2016 to November 2017.
The issues to which potential house purchasers place emphasis are quite similar across the periods. The potential big data factors are the rise and fall of house price, interest and mortgage rates, property and housing investments, house building, inflation and recession. There is only one new issue emerging after June 2016 which is “Brexit”.
Table1: Topics Based on Natural Language Processing
| Period |
Key Topics and Phrases/Real Estate |
| Jan 2004 – Mar 2008 |
Price, Rise, Mortgage, Interest, Rate, Economy, Growth, Property, Housing, Investment |
| Apr 2008 – Sep 2009 |
Price, Rise, Fall, Mortgage, Interest, Rate, Economy, Growth, Property, Housing, Investment, House, Building |
| Oct 2009 – Jun 2016 |
Price, Rise, Mortgage, Interest, Rate, Economy, Growth, Property, Housing, Investment, House, Building |
| Jul 2016 – Nov 2017 |
Brexit, Price, Rise, Mortgage, Interest, Rate, Economy, Growth, Property, Housing, Investment, House, Building |
| Summary of Topics
|
house price, house price rise, house price fall, mortgage rate, interest rate, UK property Investment, housing investment, property investment, house building, inflation, recession, Brexit |
For each of the topics listed in Table 1, we can construct big data indicators based on the monthly growth rate of Google search volume of the topic, for example the monthly growth rate of Google search volume of the key topic “house price” in the UK reflects the information demand for twelve months (Appendix 1 has a list of all search terms used.). We also construct variables about macroeconomic and market conditions. The macroeconomic variables to be tested are monthly growth rates of the UK gross domestic product, unemployment rate, consumer price index, the Sterling 3-month interbank rate, the yield of 10-year British government securities and the average Sterling Exchange Rate (listed in Appendix 2). To measure the housing market conditions, we adopt monthly growth rates of the unemployment in the British construction industry, the British construction new orders, the British housing new orders, the UK construction weekly earnings and construction confidence indicator (listed in Appendix 3).
- Analysis and Prediction with Various Sources
Having defined relevant variables measuring information demand, macroeconomic and market conditions, we can now analyse the effects they have on the British housing market. Our statistical analysis is undertaken using the well-known VAR model, with which we can capture the factors influencing short-term future housing output.
We first document that big data indicators alone can provide some new information on the housing market dynamics and generate some useful forecasts. We then provide forecasts with standard factors measuring macroeconomic and construction market conditions, and compare them with the big data forecasts. We conclude our section with forecasts adopting all information from big data, macroeconomic and market conditions.
5.1 Forecasting Housing Output with Big Data
This section illustrates the predictability of housing output using big data indicators. Based on the natural language processing of text documents, we construct twelve big data indicators to catch potential buyers’ interest in housing. The factors cover potential buyers’ information searches on house price trends, investment activities, market and macroeconomic conditions.
The results from the VAR exercise are summarised in Table 2 where the cells denote statistically significant effects (at the 10% level) over the last year on the variable in the current month listed in the columns. So, for example, over the last year a one percent increase in Google search volumes of “house price rise” in Britain is correlated to a 0.02 per cent increase in housing output, while the information demand on “house price” and “house price fall” have no effect on future housing output. This means that, in the data, there is a disproportionate effect of the general public’s information searches on the direction of housing output.
As one would expect, an increase in Google searches on “mortgage rate”, “inflation”, and “recession” are all negatively correlated to future housing output. Meanwhile, based on the current available big data indicators on “Brexit” and “UK property investment”, this issue has not affected the housing market.
Table 2: Big Data Factors Influencing Housing Output
| A 1% increase in these search topics |
Effect on housing Output, percent increase |
| house price |
Not significant |
| house price rise |
0.02 |
| house price fall |
Not significant |
| mortgage rate |
-0.04 |
| interest rate |
Not significant |
| UK property investment |
Not significant |
| housing investment |
Not significant |
| property investment |
Not significant |
| house building |
Not significant |
| inflation |
-0.08 |
| recession |
-0.02 |
| Brexit |
Not significant |
Note: 1. While the search of all other key words is from the UK, “UK property investment” reflect worldwide Google research interest. 2. All significant coefficients with P<0.10 are listed in the table.
We then can predict the British housing output with big data indicators. As shown in Figure 3, we use big data indictors to provide forecasts for eight periods starting from June 2017. We find our big data forecasts provide housing output forecasts within the confidence interval for the three sample periods[5].
Figure 3: Forecasting Housing Output with Big Data

Note: The bars define the confidence interval of our forecasts.
Table 3 provides a closer examination on errors of big data forecasts by comparing the forecasts with their actual values between July and September 2017. We find that the average forecast errors for housing output growth rates is 0.77%.
Table 3: Big Data Forecast Errors of Housing Output
| Housing Output Forecasts |
| Horizon |
Forecast |
Actual |
Forecast Error |
| July 2017 |
-0.10 |
0.43 |
0.53 |
| Aug 2017 |
-0.02 |
0.80 |
0.82 |
| Sep 2017 |
0.02 |
0.97 |
0.95 |
| Mean (Error) = 0.77 |
Note: Mean (Error) stands for the mean of forecast errors.
5.2 Forecasting Housing Output with Macroeconomic Factors and Market Conditions
Following the model set-up, we analyse the impact of macroeconomic factors and construction conditions. In Table 4, we find that the UK GDP growth has strong and significant correlations with housing output increases, with a one percent increase in GDP correlated with 0.55% increase in housing output. Meanwhile, the short-term interest rate has a negative effect on future housing output with a one percent increase in interest rate corresponding to 0.02 percent decrease in housing output. In contrast, all other macroeconomic variables, including unemployment rate, exchange rate and economic sentiment are not directly related to short-term future changes in housing output.
Based on macroeconomic variables we can conduct predictions for GB housing output. While the predicted housing output values between July and September 2017, presented in Figure 4, are still in the confidence interval, they seem to deviate more from the actual values than the big data predictions. Table 5 supports this point, as the mean of forecast errors for housing output is bigger than Table 4. Therefore, forecasts based on macroeconomic factors are not as robust as the ones based on big data.
Table 4: Macroeconomic Factors Influencing Housing Output
| A 1% increase in these factors |
Housing Output, percent increase |
| UK GDP |
0.55 |
| UK Overall Unemployment |
Not significant |
| Inflation Rate |
Not significant |
| Three Month Bill Rate |
-0.02 |
| Ten Year Bond Yield |
Not significant |
| Exchange Rate |
Not significant |
| Macroeconomic Sentiment |
Not significant |
Note: All significant coefficients with P<0.10 are listed in the table.
Figure 4: Forecasting Housing Output with Macroeconomic Variables
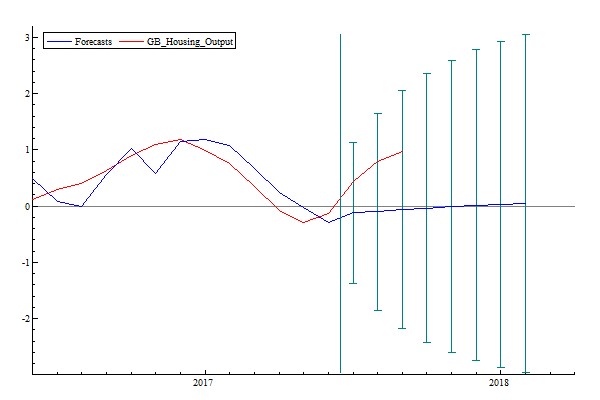
Table 5: Macroeconomic Forecast Errors of Housing Output
| Housing Output Forecasts |
| Horizon |
Forecast |
Actual |
Forecast Error |
| July 2017 |
-0.12 |
0.43 |
0.53 |
| Aug 2017 |
-0.10 |
0.80 |
0.90 |
| Sep 2017 |
-0.06 |
0.97 |
1.04 |
| Mean (Error) = 0.83 |
Note: Mean (Error) stands for the mean of the forecast errors.
We also looked at the effects of construction market conditions, by examining UK construction labour market conditions and construction and housing new orders. From Table 6, while employment and earnings have not played an important role in housing market dynamics, housing new orders and house prices are positively related to future levels of British housing output. Forecasts based on market conditions are presented in Figure 5 and Table 7. With the mean of forecast errors 0.72%, the forecasts based on market conditions are more robust than the forecasts based on the big data or macroeconomic conditions. However, they are not robust enough as the error is still too big.
Table 6: Market Conditions Factors Influencing Housing Output
| A 1% increase in these factors |
Housing Output, percent increase |
| UK House Price |
0.10 |
| UK Construction Unemployment |
Not significant |
| GB Housing New Order |
0.04 |
| UK Construction Weekly Earnings |
Not significant |
| UK Construction Confidence |
Not significant |
Note: All significant coefficients with P<0.10 are listed in the table.
Figure 5: Forecasting Housing Output with Construction and Housing Market Conditions
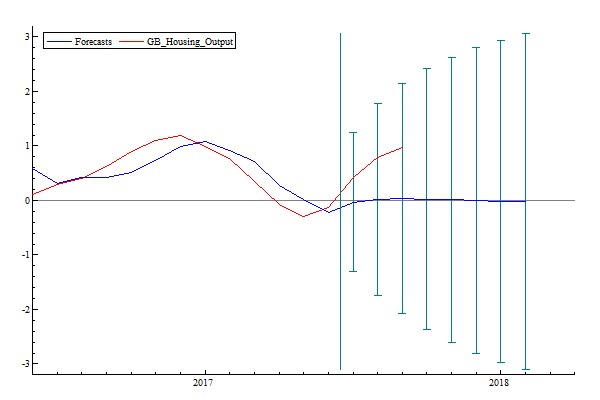
Table 7 Forecast Errors of Housing Output Based on Market Conditions
| Housing Output Forecasts |
| Horizon |
Forecast |
Actual |
Forecast Error |
| July 2017 |
-0.03 |
0.43 |
0.46 |
| Aug 2017 |
0.02 |
0.80 |
0.77 |
| Sep 2017 |
0.03 |
0.97 |
0.94 |
| Mean (Error) = 0.72 |
Note: Mean (Error) stands for the mean of the forecast errors.
In summary, big data, macroeconomic factors and market conditions all provide useful information to predict future housing market dynamics. We are going to explore the opportunity of combining the three groups of information to produce better forecast.
5.3 Forecasting Housing Output with Macroeconomic, Market and Big Data
Using the VAR model underlying the results reported in Tables 3 to 7, we can make predictions of housing output using all available information on the economy and market, including big data search topics used for natural language processing. Table 8 summarises the main factors influencing housing output, in line with our results recorded in Tables 2, 4 and 6. With a coefficient of 0.57, GDP growth plays an important and significant role in housing output increases. An increase in market participants’ interest exploring house prices will also lead to more housing output. When housing market participants are searching more for information on inflation and recession, their potential concerns about the economy correspond to a decrease in the housing output.
One striking thing is that, in this model, macroeconomic and market conditions factors like the short-term interest rate, house price, and housing new orders, are not significant. Their impact on future housing output was found to be very limited by related big data indicators measuring inflation, house price increase and house building.
The inclusion of all related factors inthe model leads to much better forecasts than ones based on partial information.As shpwn in Figure 7 and Table 9, predicted values between July and September 2017 are very close to the actual ones, and have the smallest mean forecast error of 0.16%.
Table 8: All Factors Influencing Housing Output
| A 1% increase in these factors |
Housing Output, percent increase |
| UK GDP |
0.57 |
| house price rise (Big Data) |
0.02 |
| house building (Big Data) |
0.10 |
| Inflation (Big Data) |
-0.07 |
| Recession (Big Data) |
-0.02 |
Note: All significant coefficients with P<0.10 are listed in the table. To save space, we do not present insignificant variables in this table.
Figure 6: Forecasting Housing Output with All Available Variables
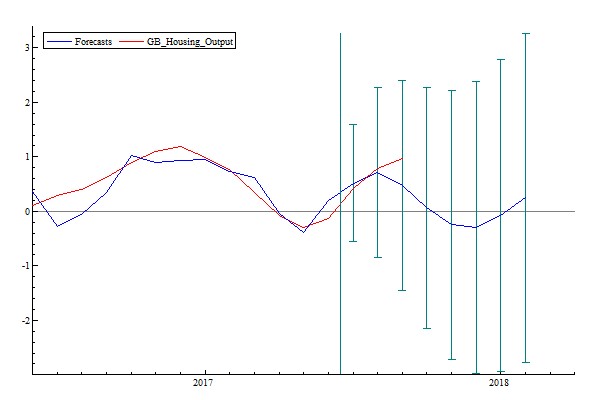
Table 9: All-Factor Forecast Errors of Housing Output
| Housing Output Forecasts |
| Horizon |
Forecast |
Actual |
Forecast Error |
| July 2017 |
0.52 |
0.43 |
-0.09 |
| Aug 2017 |
0.72 |
0.80 |
0.08 |
| Sep 2017 |
0.47 |
0.97 |
0.50 |
| Mean (Error) = 0.16 |
Note: Mean (Error) stands for the mean of the forecast errors.
- Conclusion
This study provides an application of AI based big data analysis to short-term forecasting of construction output. Using the TRUST framework, and structurally testing the data available, we can identify the key factors affecting UK housing output. The model also provides short-term, robust predictions over three quarters, by taking into consideration all available information combining media and Internet data with macroeconomic and market conditions statistics. Testing of individual VAR models using big data and macroeconomic factors had mean error rates of 0.77 and 0.83 respectively, showing how difficult short-term forecasting of housing output is. However, when combined into an all factors model the mean error falls to 0.16.
From Google search volumes we find housing market participants are very interested in market conditions, with searches for house price increases and house building positively related to future housing output. On the other hand, searches on macroeconomic factors like inflation, mortgage rates and the business cycle also are negatively related to future housing output.
While AI-based big data analytics can help to explain the short-term dynamics in the housing markets and provide some useful short-term forecasts of construction output, these forecasts are not reliable. However, incorporating them in a conventional VAR forecasting model, using all related information on macroeconomic and market conditions, significantly improves the robustness of the forecasts. The analysis and forecast approach presented in this study does not to replace the traditional models, but improves the accuracy of forecasting by combining them with other available information from big data sources, and adopting advances from NLP techniques, big data analytics and econometric modelling. This approach can be extended by applying big data analytics to more sources such as TV programme scripts, YouTube video comments, social media data, based on recent advances in artificial intelligence, e.g. Blei and Lafferty (2009).
This is an innovative approach to construction forecasting, and with the rate of increase in data will be a promising area for future construction economics and statistics research. So far, many big data sources are only available for a handful of years, Google search volumes are only traceable since 2004This limits our capability for analysing and predicting housing output, which is highly influenced by business cycles and peoples’ expectations of future house price increases However, advances in modelling techniques are providing more robust long-term analysis and forecasts For example, new developments in dynamic panel data modelling (Gengenbach, et al. 2016; Westerlund and Edgerton, 2008) can capture short-term dynamics and analyse long-term relationships, and provide robust forecasts across different regions and in response to various scenarios.
We incorporate recent developments in artificial intelligence, big data analytics and statistical modelling into a coherent framework to provide analysis and robust predictions. Although our research is subject to further improvements, it does show the potential of AI based big data analytics in analysing and forecasting housing output, and similar models incorporating data from Google and other sources could be applied to other building and construction statistics.
Appendix 1: Big Data Indicators Based on Google Search, January 2004 – November 2017
| Variables |
Description |
| house price |
Monthly growth rate of Google search volume of the key topic “house price” in the UK |
| house price rise |
Monthly growth rate of Google search volume of the key word “house price rise” in the UK |
| house price fall |
Monthly growth rate of Google search volume of the key word “house price fall” in the UK |
| mortgage rate |
Monthly growth rate of Google search volume of the key word “mortgage rate” in the UK |
| interest rate |
Monthly growth rate of Google search volume of the key word “interest rate” in the UK |
| UK property investment |
Monthly growth rate of global Google search volume of the key word “UK property investment” |
| housing investment |
Monthly growth rate of Google search volume of the key word “housing investment” in the UK |
| property investment |
Monthly growth rate of Google search volume of the key word “property investment” in the UK |
| house building |
Monthly growth rate of Google search volume of the key word “inflation” in the UK |
| inflation |
Monthly growth rate of Google search volume of the key word “Recession” in the UK |
| recession |
Monthly growth rate of Google search volume of the key word “house building” in the UK |
| Brexit |
Monthly growth rate of Google search volume of the key word “Brexit” in the UK |
Note: All the monthly growth rates are the moving average of current and the past 11 months.
Appendix 2: Macroeconomic Variables, January 2004 – November 2017
| Variables |
Description |
Resource |
| UK GDP |
Monthly growth rate of the UK gross domestic product |
ONS |
| UK Overall Unemployment |
Monthly growth rate of the UK unemployment rate |
ONS |
| Inflation Rate |
Monthly growth rate of the UK consumer price index |
ONS |
| Three Month Bill Rate |
Monthly growth rate of the Sterling 3-month interbank rate |
BOE |
| Ten Year Bond Yield |
Monthly growth rate of the yield of 10-year British government securities |
BOE |
| Exchange Rate |
Monthly growth rate of the average Sterling Exchange Rate |
BOE |
| Macroeconomic Sentiment |
Monthly growth rate of the UK Economic Sentiment Indicator |
EU Commission DG ECFIN |
Appendix 3: Market Conditions, January 2004 – November 2017
| Variables |
Description |
Resource |
| GB Housing Output |
Monthly growth rate of housing output in Great Britain |
ONS |
| UK House Price |
Monthly growth rate of the UK house price index |
ONS |
| UK Construction Unemployment |
Monthly growth rate of unemployment in the UK construction industry |
ONS |
| GB Housing New Order |
Monthly growth rate of the British housing new orders |
ONS |
| UK Construction Weekly Earnings |
Monthly growth rate of the UK construction weekly earnings |
ONS |
| UK Construction Confidence |
Monthly growth rate of the UK Construction Confidence Indicator |
EU Commission DG ECFIN |
References
Akintoye, A. and M. Skitmore (1993), Macro models of UK construction prices, Civil Engineering Systems, 10 (4), pp. 279-299.
Akintoye, A. and M. Skitmore (1994), Models of UK private sector quarterly construction demand, Construction Management and Economics, 12 (1), pp. 3-13.
Al Qady, M. and A. Kandil (2009), Concept relation extraction from construction documents using natural language processing, Journal of Construction and Engineering Management, 136 (3), pp.294–302.
Aouadi, A. Arouri, M. and F. Teulon (2013). Investor attention and stock market activity: Evidence from France. Economic Modelling, 35, pp. 674–681.
Best, R. and J. Meikle (2015), Endnote, in Best, R. and J. Meikle ed. Measuring Construction, Routledge.
Bilal, M., Oyedele, L., Qadir, J., Munir, K., Ajayi, S. ed, Akinade, O., Owolabi, H. A., Alaka, H. A. and Pasha, M. (2016), Big data in the construction industry: A review of present status, opportunities, and future trends, Advanced Engineering Informatics, 30 (3). pp. 500-521.
Blei, D. M., Ng, A. Y. And M. I Jordan, (2003) in J. Lafferty ed. Latent Dirichlet allocation, Journal of Machine Learning Research, 3 (4–5), pp. 993–1022.
Blei, D. M., and J. Lafferty (2009), Topic Models, in A. Srivastava and M. Sahami (ed.), Text Mining: Theory and Applications. Taylor and Francis.
Choi, H. and H. Varian (2012). Predicting the present with Google Trends. Economic Record, 88, pp. 2-9.
Da, Z., Engelberg, J. and P. Gao (2011). In search of attention. The Journal of Finance, 66(5), pp. 1461-1499.
Das, P., Ziobrowski, A., and N. E. Coulson (2015), Online information search, market fundamentals and apartment real estate, Journal of Real Estate Finance and Economics, 51 (4), pp. 480-502.
Dean, J. (2014) Big Data, Data Mining, and Machine Learning: Value Creation for Business Leaders and Practitioners, John Wiley and Sons.
De Livera, A. M., Hyndman, R. J., and R. D. Snyder (2011), Forecasting time series with complex seasonal patterns using exponential smoothing, Journal of the American Statistical Association, 106, pp. 1513-1527.
Dorward, F., A. Akintoye, and C. Hardcastle (1998). The Causal relationship between construction workload and construction price, Applied Economics Letters, 5, pp. 15-18.
Fan, R. Y. C., Ng, S. T. and J. M. W. Wong (2010), Reliability of the Box-Jenkins model for forecasting construction demand covering times of economic austerity, Construction Management and Economics, 28 (3), pp. 241-254.
Fondeur, Y. and F. Karamé (2013). Can Google data help predict French youth unemployment? Economic Modelling, 30, pp. 117-125.
Gengenbach, C., Urbain, J.-P and J. Westerlund (2016), Error correction testing in panels with common stochastic trends, Journal of Applied Econometrics, Vol 31 (6), pp.1099-1255.
Goddard J., Kita, A. and Q. Wang (2015). Investor attention and FX market volatility, Journal of International Financial Markets, Institutions and Money, 38, pp.79-96.
Goh, B. H. (2008), The State of Applications of Quantitative Analysis, Construction Management and Economics, 26(5), pp.485-497.
Haynes, Stephen E., and Joe A. Stone. 1985. “A Neglected Method of Separating Demand and Supply in Time Series Regression.” Journal of Business & Economic Statistics, 3(3): 238-243.
Hua, G.B. and T.H. Pin (2000), Forecasting construction industry demand, price and productivity in Singapore: The Box-Jenkins approach, Construction Management and Economics, 18(5), pp. 607-618.
Hyndman, R. J., Koehler, A. B., Snyder, R. D., and S. Grose (2002), A state space framework for automatic forecasting using exponential smoothing methods, International Journal of Forecasting, 18, pp. 439-454.
Laney, D. (2001), “3-D Data Management: Controlling Data Volume, Velocity and Variety,” META Group Research Note, February 6. http://goo.gl/Bo3GS.
Larson, W. D. (2011), Evaluating alternative methods of forecasting house prices: A post-crisis reassessment, GWU Research Program on Forecasting Working Paper Series, 2010-004.
Li, H. (1995), Neural networks for construction cost estimation, Building Research and Information, 23(5), pp. 279-284.
Lunsford, K. G. (2015) Forecasting residential investment in the United States, International Journal of Forecasting, 31, pp. 276-285.
MacDonald, R. and X. Mao (2015), Predicting the outcome of the Scottish independence referendum: The information from the Ether, University of Glasgow Economics Working Papers, No. 2015-05.
MacDonald, R. and X. Mao (2016), Forecasting the 2015 General Election with Internet big data: An application of the TRUST framework, University of Glasgow Economics Working Papers, No. 2016-03.
McCaffer, R., McCaffrey, M. J. and A. Thorpe (1983), The Disparity between Construction Cost and Tender Price Movements, Construction Papers, Chartered Institute of Building, 2(2), pp. 17-27.
Miles, W. (2008), Boom-bust cycles and the forecasting performance of linear and non-linear models of house prices, Journal of Real Estate Finance and Economics, 36, pp. 249-264.
ONS (2017), Internet Access – Households and Individuals, Available at https://www.ons.gov.uk/peoplepopulationandcommunity/householdcharacteristics/homeinternetandsocialmediausage/bulletins/internetaccesshouseholdsandindividuals/2017/pdf
Statista, Inc. (7 Dec 2017), Worldwide Market Share of Leading Search Engines from January 2010 to October 2017, Available at
http://www.statista.com/statistics/216573/worldwide-market-share-of-search-engines/
Takeda, F. and T. Wakao (2014). Google search intensity and its relationship with returns and trading volume of Japanese stocks. Pacific-Basin Finance Journal, 27, pp. 1-18.
Vlastakis, N. and R. N. Markellos (2012). Information demand and stock market volatility. Journal of Banking and Finance, 36(6), pp. 1808-1821.
Vozlyublennaia, N. (2014). Investor attention, index performance, and return predictability. Journal of Banking and Finance, 41, pp. 17-35.
Wei, Y. and Y. Cao (2017), Forecasting house prices using dynamic model averaging approach: Evidence from China, Economic Modelling 61. P 147-155.
Westerlund, J. and D. L. Edgerton (2008), A simple test for cointegration in dependent panels with structural breaks, Oxford Bulletin of Economics and Statistics, 70(5), pp. 665-704.
Williams, T. P. (1994). Predicting changes in construction cost indexes using neural network, Journal of Construction Engineering and Management, 120(2), pp. 306-320.
Wilmot, C. G. and B. Mei (2005), Neural network modelling of highway construction costs, Journal of Construction Engineering and Management, 131(7), pp. 765-771.
Witten, I.H. and E. Frank (2005) Data Mining: Practical Machine Learning Tools and Techniques, Morgan Kaufmann.
Wong, J. M. W. and S. T. Ng (2010), Forecasting construction tender price index in Hong Kong using vector error correct model, Construction management and Economics, 28(12), pp. 1255-1268.
Wu, L. and E. Brynjolfsson (2015), The Future of Prediction: How Google Searches Foreshadow Housing Prices and Sales, in A. Goldfarb, S. M. Greenstein, and C. E. Tucker, ed. Economic Analysis of the Digital Economy, University of Chicago Press, p 89-118.
Yu, K. W. (2015), The Economics of Construction Price Inflation in the UK: Measurement, Output and Productivity, Doctoral thesis, UCL (University College London)
Zhang, J. and N. El-Gohary (2012), Extraction of construction regulatory requirements from textual documents using natural language processing techniques, Journal of Computing in Civil Engineering, pp.453–460.
Zhang, J. and N.M. El-Gohary (2016), Semantic NLP-based information extraction from construction regulatory documents for automated compliance checking, Journal of Computing in Civil Engineering, 30 (2)
Zietz, J. and A. Traian (2014), When was the U.S. housing downturn predictable? A comparison of univariate forecasting methods, The Quarterly Review of Economics and Finance, 54, pp. 271-281.
[1] Section 2 provides a detailed literature review on the related studies.
[2] Among many others, Construction Products Association, Cambridge Econometrics, Experian, and Oxford Economics provide construction forecasts which are based on standard macro-econometric modelling techniques.
[3] Nowadays, most national newspapers and documents have an online version. Even if some contents are gated, readers can still read some of the reports which often contain key information.
[4] The great recession period in the UK is between April 2008 and September 2009. During the period, the UK GDP grew negatively for 5 continuous quarters.
[5] While the VAR model can provide forecasts for more periods, this study only focuses on the short-term predictability of up to three periods.